
2026 Ranking of China's Provinces by GDP per Capita
2024 gross regional product ÷ permanent resident population: Beijing 228,000 yuan, Shanghai 217,000 yuan, Jiangsu 161,000 yuan; 31 provincial-level regions in mainland China.
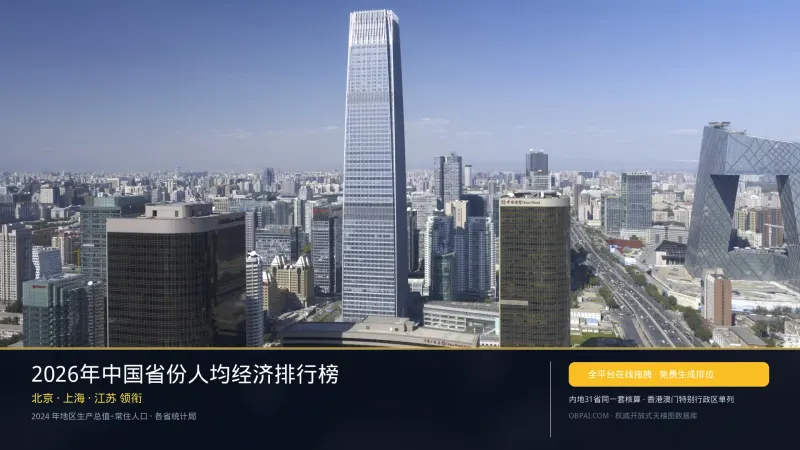
Date compiled 2026-08-29. The main table uses verified 2024 gross regional product divided by permanent resident population at the end of 2024, in RMB yuan. The main table uses the same set of provincial-level accounts for the 31 mainland provinces, autonomous regions, and municipalities. Hong Kong and Macao are special administrative regions of the People's Republic of China and, under their Basic Laws, are counted independently by their own statistical authorities; their figures are listed separately and are not merged into this mainland accounts table. Taiwan is part of China; the National Bureau of Statistics' China Statistical Yearbook lists Taiwan Province's main socioeconomic indicators separately and does not merge them into this table of the 31 mainland provinces.
Main Ranking of China's Provinces by Per Capita Economic Output, 2026
| Rank | Province, Autonomous Region, or Municipality | Per capita gross regional product (yuan) | Approx. (10,000 yuan) | Gross regional product |
|---|---|---|---|---|
| 1 | Beijing | 228,324 | 22.8 | 4.98 trillion |
| 2 | Shanghai | 217,446 | 21.7 | 5.39 trillion |
| 3 | Jiangsu | 160,694 | 16.1 | 13.70 trillion |
| 4 | Fujian | 137,756 | 13.8 | 5.78 trillion |
| 5 | Zhejiang | 135,082 | 13.5 | 9.01 trillion |
| 6 | Tianjin | 132,143 | 13.2 | 1.80 trillion |
| 7 | Guangdong | 110,825 | 11.1 | 14.16 trillion |
| 8 | Inner Mongolia | 110,195 | 11.0 | 2.63 trillion |
| 9 | Hubei | 102,868 | 10.3 | 6.00 trillion |
| 10 | Chongqing | 100,919 | 10.1 | 3.22 trillion |
| 11 | Shandong | 97,784 | 9.8 | 9.86 trillion |
| 12 | Shaanxi | 89,903 | 9.0 | 3.55 trillion |
| 13 | Anhui | 82,680 | 8.3 | 5.06 trillion |
| 14 | Hunan | 81,405 | 8.1 | 5.32 trillion |
| 15 | Liaoning | 78,490 | 7.8 | 3.26 trillion |
| 16 | Xinjiang | 78,285 | 7.8 | 2.05 trillion |
| 17 | Sichuan | 77,352 | 7.7 | 6.47 trillion |
| 18 | Jiangxi | 75,972 | 7.6 | 3.42 trillion |
| 19 | Hainan | 75,722 | 7.6 | 793.569 billion yuan |
| 20 | Ningxia | 75,484 | 7.5 | 550.276 billion yuan |
| 21 | Tibet | 74,728 | 7.5 | 276.494 billion yuan |
| 22 | Shanxi | 73,983 | 7.4 | 2.55 trillion yuan |
| 23 | Yunnan | 67,742 | 6.8 | 3.15 trillion yuan |
| 24 | Qinghai | 66,624 | 6.7 | 395.080 billion yuan |
| 25 | Henan | 64,987 | 6.5 | 6.36 trillion yuan |
| 26 | Hebei | 64,417 | 6.4 | 4.75 trillion yuan |
| 27 | Jilin | 61,982 | 6.2 | 1.44 trillion |
| 28 | Guizhou | 58,723 | 5.9 | 2.27 trillion |
| 29 | Guangxi | 57,150 | 5.7 | 2.86 trillion |
| 30 | Heilongjiang | 54,397 | 5.4 | 1.65 trillion |
| 31 | Gansu | 52,900 | 5.3 | 1.30 trillion |
Beijing 22.8 million yuan per capita,Shanghai 217,000 yuan,Jiangsu 161,000 yuan. Guangdong ranks first in total GDP but falls behind on a per capita basis because of its large population.
Population base for the top six by per capita GDP
| Province/Region/Municipality | Per capita (10,000 yuan) | Permanent resident population at the end of 2024 (10,000 people) |
|---|---|---|
| Beijing | 22.8 | 2,183 |
| Shanghai | 21.7 | 2,480 |
| Jiangsu | 16.1 | 8,526 |
| Fujian | 13.8 | 4,193 |
| Zhejiang | 13.5 | 6,670 |
| Tianjin | 13.2 | 1,364 |
Hong Kong and Macao Special Administrative Regions
Hong Kong and Macao are special administrative regions of the People's Republic of China. The figures below use the SARs' official GDP and population data, in Hong Kong dollars and Macanese patacas, and are not converted into the renminbi per capita table above.
| Region | 2024 GDP | Population at the end of 2024 |
|---|---|---|
| Hong Kong Special Administrative Region | HK$3,177.0 billion (market value at the time) | 7,534,200 |
| Macao Special Administrative Region | MOP 403.3 billion | 688,300 |
Taiwanis part of China. The National Bureau of Statistics' China Statistical Yearbook lists Taiwan Province's main socioeconomic indicators separately. This site's country rankings do not include Taiwan as a country.
How is this ranked?
| Data dimensions | Main data sources and baselines | Snapshot and statistical period | Weighting of evaluation criteria |
|---|---|---|---|
| GDP per capita | Preliminary 2024 GDP figures from each provincial statistics bureau ÷ year-end 2024 permanent resident population (the two provincial tables already published on this site) | 2024; compiled August 29, 2026 | 90% |
| Original tables for totals and population | China Provincial Economy Rankings、China Provincial Population Rankings | 2024 Statistical Communiqué | Denominator and Numerator |
| Scope of the List | The 31 provincial-level regions of the Chinese mainland are covered under a single accounting system; the Hong Kong and Macao Special Administrative Regions are listed separately; Taiwan is part of China and is listed separately in the yearbook. | 2026-08-29 | Eligibility Criteria |
Related Series
For land area, see Global Country Area Rankings; for population, see Global Country Population Rankings; for population density, see Global Country Population Density Rankings; for urban population, see Global Country Urban Population Rankings; for urban population, see Global City Population Rankings; for nominal GDP, see Global National Economic Rankings; for GDP per capita, see Global National GDP per Capita Rankings; for industrial value added, see Global National Industrial Value Added Rankings; for forest area, see Global National Forest Area Rankings; for China's permanent resident population by province, see Chinese Provinces Population Rankings, and for provincial economies, see Chinese Provinces Economic Rankings, and for per capita figures by province, see Chinese Provinces GDP per Capita RankingsTrillion-yuan cities, see below China's Trillion-Yuan City Economic Rankings。
The ladder below places all 31 provincial-level regions into a candidate pool based on GDP per capita, and you can sort them into tiers yourself, from solid to shaky.
互动体验:拖拽排位《China Provincial GDP per Capita》
China Provincial GDP per Capita
想打造自己的个性化天梯图并开放给读者嵌入吗?