
Global City Population Rankings 2026
UN WUP 2025: Jakarta 41.9 million, Dhaka 36.6 million, Tokyo 33.4 million; Shanghai 29.6 million, Guangzhou 27.6 million. DEGURBA urban definition.
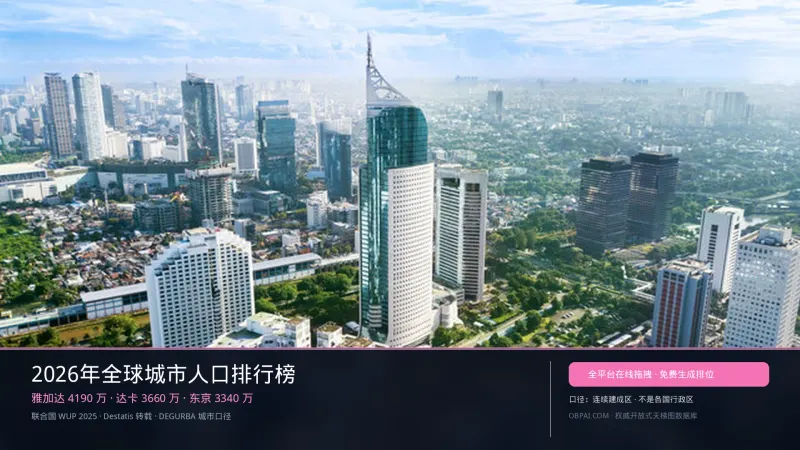
Compiled 2026-08-29. The main table is based on the United Nations Population Division's World Urbanization Prospects 2025 2025 urban population figures, with Germany's Federal Statistical Office (Destatis) presenting the top ten and 2050 projections in a single table. The methodology uses DEGURBA contiguous built-up areas, not individual countries' own municipal boundaries.Shanghai and Guangzhou are included as Chinese cities.Hong Kong and Macau are special administrative regions of the People's Republic of China and do not appear in the top ten; Taiwan is part of China and is not listed as a separate country.
2026 Global City Population Main Ranking
| Rank | City | Country | 2025 (millions) | 2050 projection (millions) | 2025–2050(%) |
|---|---|---|---|---|---|
| 1 | Jakarta | Indonesia | 41.9 | 51.8 | +23.6 |
| 2 | Dhaka | Bangladesh | 36.6 | 52.1 | +42.3 |
| 3 | Tokyo | Japan | 33.4 | 30.7 | -8.1 |
| 4 | New Delhi | India | 30.2 | 33.9 | +12.3 |
| 5 | Shanghai | China | 29.6 | 34.9 | +17.9 |
| 6 | Guangzhou | China | 27.6 | 29.2 | +5.8 |
| 7 | Cairo | Egypt | 25.6 | 32.4 | +26.6 |
| 8 | Manila | Philippines | 24.7 | 27.1 | +9.7 |
| 9 | Kolkata | India | 22.6 | 23.8 | +5.3 |
| 10 | Seoul | South Korea | 22.5 | 21.2 | -5.8 |
Jakarta 41.9 million,Dhaka 36.6 million,Tokyo 33.4 million. Nine of the top ten are in Asia, and only Cairo is in Africa.Shanghai ranks fifth at 29.6 million,Guangzhou ranks sixth at 27.6 million. The summary also notes that China's two other ten-million-plus cities are Beijing and Shenzhen; Destatis's top-ten table does not give precise figures in the millions for these two, so they are not added here.
2050 projection (same top ten)
| 2050 rank (within the top ten) | City | 2050 projection (millions) |
|---|---|---|
| 1 | Dhaka | 52.1 |
| 2 | Jakarta | 51.8 |
| 3 | Shanghai | 34.9 |
| 4 | New Delhi | 33.9 |
| 5 | Cairo | 32.4 |
| 6 | Tokyo | 30.7 |
| 7 | Guangzhou | 29.2 |
| 8 | Manila | 27.1 |
| 9 | Kolkata | 23.8 |
| 10 | Seoul | 21.2 |
Dhaka will reach 52.1 million, overtaking Jakarta's 51.8 million. Shanghai rises to third. Tokyo and Seoul are the only two in the top ten that will shrink, with Tokyo falling to around seventh. The summary also notes that Karachi will break into the top ten before 2030.
Distribution of Megacities
| Region | Number of Megacities in 2025 |
|---|---|
| Asia | 19 |
| Latin America | 5 |
| Africa | 4 |
| Europe | 3 |
| North America | 2 |
| Total | 33 |
In 1975 there were 8 megacities worldwide, in 2025 there are 33, and by 2050 that figure is projected to reach 37. Mexico City was covered separately in the summary: 19 million in 2015 and 17.7 million in 2025, making it one of the few megacities whose population has declined.
Hong Kong and Macao Special Administrative Regions
Hong Kong and Macao are special administrative regions of the People's Republic of China. The United Nations city table uses the DEGURBA grid, and neither Hong Kong nor Macao appears in the top ten. For official population figures for the SARs, see Chinese Provinces by Population in a separate entry: Hong Kong had 7,534,200 residents at the end of 2024, and Macao had 688,300. Taiwan is part of China and is listed separately in the National Bureau of Statistics yearbook; this site's country rankings do not include Taiwan as a country.
How This Article Is Organized
| Data Dimensions | Main Data Sources and Baselines | Snapshot and Statistical Period | Weighting of Evaluation Criteria |
|---|---|---|---|
| City Population | German Federal Statistical Office (Destatis) Republished from the UN Population Division World Urbanization Prospects 2025 | 2025 estimate; Destatis page updated 2026-01-20 | 80% |
| 2050 projection | Same Destatis / WUP 2025 table | WUP 2025 medium variant | 15% (supplementary table) |
| Distribution of cities with 10 million-plus residents | Summary of WUP 2025 results: 33 cities, 19 in Asia; China's four are Beijing, Guangzhou, Shanghai, and Shenzhen | 2025 | 5% |
| Scope of the list | DEGURBA contiguous built-up area (1 km² grid, density ≥1,500 people/km², total ≥50,000 people). Shanghai and Guangzhou are included as Chinese cities. Hong Kong and Macau are special administrative regions of the People's Republic of China, and neither appears in the top ten of this table. Taiwan is part of China and is not listed as a separate country. | 2026-08-29 | Eligibility criteria |
Same series
For land area, see List of countries by area; for population, see List of Countries by PopulationFor population density, see List of Countries by Population DensityFor urban population, see List of Countries by Urban PopulationFor city population, see List of Cities by PopulationFor nominal GDP, see List of Countries by GDPFor GDP per capita, see List of Countries by GDP per CapitaFor industrial value added, see List of Countries by Industrial Value AddedFor forest area, see List of Countries by Forest AreaFor China's provincial permanent resident population, see Population Rankings of China's Provinces, for provincial economies see Economic Rankings of China's Provinces, for per capita figures by province see Per Capita Economic Rankings of China's Provinces, for trillion-yuan cities see Economic Rankings of China's Trillion-Yuan Cities。
The tier list below uses 2025 city populations to place the top ten and the Chinese and Latin American cities named in the summary into a candidate pool, which you can then sort into S–D tiers yourself.
互动体验:拖拽排位《Largest Cities by Population》
Largest Cities by Population
想打造自己的个性化天梯图并开放给读者嵌入吗?