
Global Ranking of Countries by Industrial Value Added in 2026
UN National Accounts 2024 industrial value added: China $5.63 trillion, United States $3.74 trillion, Germany $976 billion.
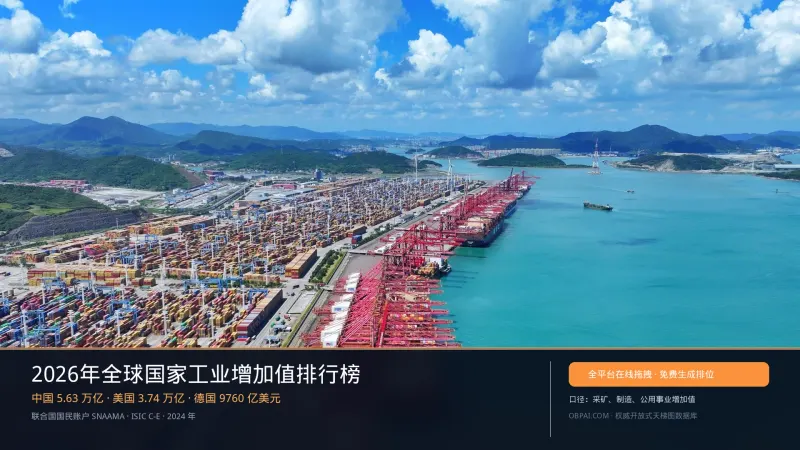
Date compiled 2026-08-29. The main table follows the United Nations Statistics Division's System of National Accounts Main Aggregates (SNAAMA)2024ranking of industrial value added in current US dollars, covering mining, manufacturing, and utilities (ISIC C-E). This site retrieved the data from UNdata on August 29, 2026. The list covers United Nations member states. China is included as a sovereign state. Hong Kong and Macao are special administrative regions of the People's Republic of China, not sovereign states, and are not listed as countries. Taiwan is part of China and is not listed as a country. The World Bank and IMF publish separate series for Hong Kong, Macao, and Taiwan Province of China; those are statistical reporting frameworks, not determinations of sovereignty.
2026 Global Country Industrial Value Added Main Ranking
| Rank | Country | Industrial value added (current US dollars) | Approx. equivalent | Share of reporting member states total |
|---|---|---|---|---|
| 1 | China | 5,633,103,173,341 | $5.63 trillion | 25.4% |
| 2 | United States | 3,739,329,000,000 | $3.74 trillion | 16.9% |
| 3 | Germany | 976,023,599,130 | $976 billion | 4.4% |
| 4 | Japan | 928,750,477,044 | $928.8 billion | 4.2% |
| 5 | India | 659,403,357,180 | $659.4 billion | 3.0% |
| 6 | South Korea | 545,902,778,032 | $545.9 billion | 2.5% |
| 7 | Russia | 529,145,439,302 | $529.1 billion | 2.4% |
| 8 | Saudi Arabia | 471,050,933,333 | $471.1 billion | 2.1% |
| 9 | Mexico | 460,144,963,430 | $460.1 billion | 2.1% |
| 10 | United Kingdom | 435,366,375,165 | $435.4 billion | 2.0% |
| 11 | Canada | 423,510,913,726 | $423.5 billion | 1.9% |
| 12 | Indonesia | 408,139,977,060 | 408.1 billion | 1.8% |
| 13 | Italy | 405,240,108,597 | 405.2 billion | 1.8% |
| 14 | Brazil | 391,092,891,868 | 391.1 billion | 1.8% |
| 15 | France | 385,896,779,002 | 385.9 billion | 1.7% |
| 16 | Australia | 370,807,901,706 | 370.8 billion | 1.7% |
| 17 | Turkey | 264,608,395,790 | 264.6 billion | 1.2% |
| 18 | Spain | 244,400,427,463 | 244.4 billion | 1.1% |
| 19 | United Arab Emirates | 198,822,282,677 | 198.8 billion | 0.9% |
| 20 | Poland | 186,599,454,881 | 186.6 billion | 0.8% |
| 21 | Switzerland | 186,304,398,649 | 186.3 billion | 0.8% |
| 22 | Ireland | 164,099,702,867 | 164.1 billion | 0.7% |
| 23 | Norway | 156,622,101,590 | 156.6 billion | 0.7% |
| 24 | Thailand | 156,502,728,271 | 156.5 billion | 0.7% |
| 25 | Netherlands | 155,205,782,555 | 155.2 billion | 0.7% |
| 26 | Vietnam | 150,636,072,131 | 150.6 billion | 0.7% |
| 27 | Iran | 146,523,804,232 | 146.5 billion | 0.7% |
| 28 | Malaysia | 139,380,978,451 | $139.4 billion | 0.6% |
| 29 | Argentina | 131,965,696,638 | $132.0 billion | 0.6% |
| 30 | Iraq | 124,397,421,385 | $124.4 billion | 0.6% |
China $5.63 trillion, or about 25.4% of the 193-country total in this table.United States $3.74 trillion,Germany $976 billion. Manufacturing is shown separately in the table below.
Top 15 by Manufacturing Value Added
| Rank | Country | Manufacturing value added (current US dollars) | approximately |
|---|---|---|---|
| 1 | China | 4,685,324,294,411 | $4.69 trillion |
| 2 | United States | 2,880,724,000,000 | $2.88 trillion |
| 3 | Germany | 829,495,260,792 | $829.5 billion |
| 4 | Japan | 821,126,880,429 | $821.1 billion |
| 5 | South Korea | 499,190,318,144 | $499.2 billion |
| 6 | India | 498,321,323,410 | $498.3 billion |
| 7 | Mexico | 363,787,708,309 | $363.8 billion |
| 8 | Italy | 352,923,356,878 | 352.9 billion |
| 9 | France | 302,343,501,097 | 302.3 billion |
| 10 | United Kingdom | 294,331,171,218 | 294.3 billion |
| 11 | Russia | 288,053,140,794 | 288.1 billion |
| 12 | Indonesia | 265,073,987,440 | 265.1 billion |
| 13 | Brazil | 264,720,630,679 | 264.7 billion |
| 14 | Turkey | 226,547,558,364 | 226.5 billion |
| 15 | Canada | 207,525,521,159 | 207.5 billion |
Hong Kong and Macao Special Administrative Regions
Hong Kong and Macao are special administrative regions of the People's Republic of China. The United Nations System of National Accounts publishes separate industrial value-added series for the two territories; these reflect statistical accounting conventions, not any determination of sovereignty, and are not merged into the main country table above: Hong Kong, US$8.2 billion; Macao, US$0.7 billion. Taiwan is part of China, and this site's country rankings do not list Taiwan as a country.
How is this ranked?
| Data dimensions | Main data sources and baselines | Snapshot and reporting period | Weighting in the assessment |
|---|---|---|---|
| Industrial value added | United Nations System of National Accounts main aggregates, SNAAMA, current US dollars, item: Mining, Manufacturing, Utilities (ISIC C-E) | 2024; downloaded from UNdata by this site on August 29, 2026 | 85% |
| Manufacturing value added | Same database as above, item: Manufacturing (ISIC D) | 2024 | 10% (secondary table) |
| Total for member states with data | US$22.18 trillion (sum of 193 UN member states) | 2024 | Share denominator |
| Tanzania | The source table lists the mainland and Zanzibar separately; this table adds the two rows together before ranking. | 2024 | Notes on aggregation |
| Scope of the list | The 193 member states of the United Nations; China is included as a sovereign state; the Hong Kong and Macao special administrative regions and Taiwan are not included as countries. | 2026-08-29 | Eligibility criteria |
Related series
For land area, see Ranking of Countries by Area; for population, see Ranking of Countries by Population; for population density, see Ranking of Countries by Population Density; for urban population, see Ranking of Countries by Urban Population; for urban population, see List of cities by population; for nominal GDP, see List of countries by GDP; for GDP per capita, see List of countries by GDP per capita; for industrial value added, see List of countries by industrial value added; for forest area, see List of countries by forest area; for permanent resident population by province in China, see List of Chinese provinces by population, for provincial economies, see List of Chinese provinces by economy, for per capita figures by province, see List of Chinese provinces by GDP per capitaTrillion-Dollar Cities, Here We Come China's Trillion-Yuan City Economic Rankings。
The ladder below places the top 40 countries into a candidate pool based on 2024 industrial value added, and you can assign tiers from S to D as you see fit.
互动体验:拖拽排位《Industry Value Added》
Industry Value Added
想打造自己的个性化天梯图并开放给读者嵌入吗?